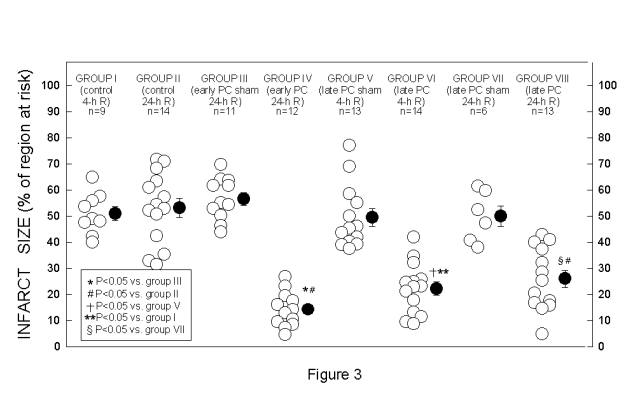
Figure 3. Myocardial infarct size in groups I (control group, 4-h reperfusion [R]), II (control group, 24-h reperfusion), III (early PC sham group, 24-h reperfusion), IV (early PC group, 24-h reperfusion), V (late PC sham group, 4-h reperfusion), VI (late PC group, 4-h reperfusion), VII (late PC sham group, 24-h reperfusion), and VIII (late PC group, 24-h reperfusion). Infarct size is expressed as a percentage of the region at risk of infarction. Open circles represent individual mice, whereas solid circles represent means ± SEM, *P<0.05 vs. group III; #P<0.05 vs. group II; =P<0.05 vs. group V; **P<0.05 vs. group I; §P<0.05 vs. group VII. Reproduced from Ref. 2 with permission.