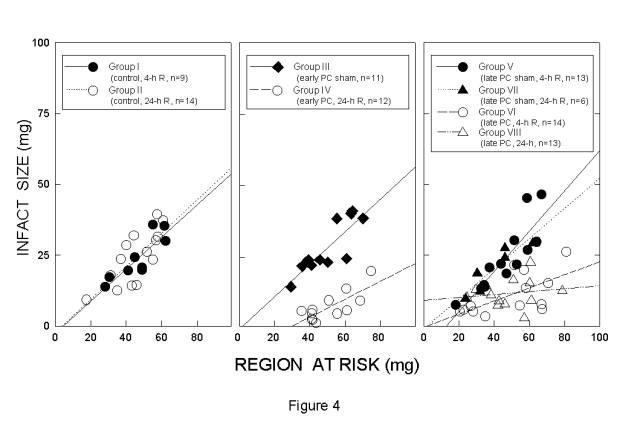
Figure 4 Relationship between size of the region at risk and size of myocardial infarction. The figure illustrates both individual values and the regression lines obtained by linear regression analysis for the various groups. Left panel. Control groups: groups I (4-h reperfusion) and II (24-h reperfusion). Middle panel. Studies of early PC: groups III (early PC sham group, 24-h reperfusion) and IV (early PC group, 24-h reperfusion). Right panel. Studies of late PC: groups V (late PC sham group, 4-h reperfusion), VI (late PC group, 4-h reperfusion), VII (late PC sham group, 24-h reperfusion), and VIII (late PC group, 24-h reperfusion). In all groups, infarct size was positively and linearly related to risk region size. The linear regression equations were as follows: group I, y= -2.55+0.57x, r=0.87, P<0.005; group II, y= -2.3+0.59x, r=0.77, P<0.001; group III, y= -1.29+0.59x, r=0.85, P<0.001; group IV, y= -8.34+0.31x, r=0.77, P<0.005; group V, y= -9.11+0.71x, r=0.87, P<0.001; group VI, y= -0.41+0.23x, r=0.64, P<0.05; group VII, y= -1.05 +0.53x, r=0.91, P=0.01; group VIII, y=9.01+0.05x, r=0.16, P=0.60. ANCOVA demonstrated that the regression line for group IV was significantly different from that for group III and that the regression lines for groups VI and VIII were significantly different from those for groups V and VII, respectively (P<0.05 for each comparison), indicating that for any given risk region size, infarct size was smaller in preconditioned mice compared to control mice. Reproduced from Ref. 2 with permission.